The Odds
By: Zachary Means, CEO
“The only value of stock forecasters is to make fortune-tellers look good.” – Warren Buffett.
Every year, top firms, analysts, and economists provide projections on the markets’ direction. They offer a year-end price target, indicating where they expect the markets to end the year.
“We are in a secular bull market,” some claim.
Truth be told, as much as they claim there is a method to their madness and predictions, nobody knows. Look at 2020 as an example. If you told these professionals there would be a pandemic in 2020, would they have surmised the market would be up? How about up over 16% on the S&P 500? I don’t think so.
“A recession is coming,” others tout.
My team asked me to provide an outlook for the markets in 2021. The more research I did and rabbit holes I fell into, the more I realized projections, especially those with a number associated with them, are futile. Perhaps some out there could “predict” a correction, once, maybe twice.
That’s luck much more than skill. Nobody gets it right 100% of the time. For some reason unknown to me, clients often equate the stock market to gambling. I often hear them say, “This is money I am willing to gamble with.”
I always try to correct them by saying, “Not gamble, invest.” There is a big difference. I have been to a casino before. I dislike them for one primary reason, success. The kind of success the House has, not the gambler.
In the top three casino games, Blackjack, Craps, and Roulette, the “house advantage” is around 5%. Currently, there is the City Center construction project going on in Las Vegas. At over $9 billion, it is the most expensive project in American history.
You can imagine who will be paying for that. “House advantage” is the percentage, over the long run, that the house retains in dollars wagered. Slots, which have the worst odds, give the house a greater edge. They typically retain around 10% of the money wagered.
What if you considered the “house advantage” analogous to time spent invested in the market?
The historical odds of making money in the US markets are roughly 50/50 daily, 68% over one year, 88% in q0 years, and 100% over 20 years. Looking back, past performance is no guarantee of future results. The S&P 500 has been up 40 of the last 50 years. Between 1971-2020, it gained an average of +10.9% per year total return.
The index had an average annual gain of +18.4% total return during the 40 “up years.” Losing an average of 14.8% per year total return during the 10 “down years” (BTN Research). The longer you “play,” the better your odds. As for my prediction this year, I believe it is going to be an up year.
Here’s why:
1. The Fed
“Don’t fight the Fed” has been a slogan for the last few years. What have we had? Fantastic markets. Late in 2020, the Fed said they would likely hold rates until 2023. Holding rates artificially low is a strong tailwind for the markets.
2. COVID-19 Vaccine
We already had some positive news regarding the efficacy of the COVID-19 vaccines available. To us, this means things get better, not worse.
3. Earnings
With 2020 earnings are behind us, things are looking up. The current price/earnings ratio (P/E) of the S&P 500 is 38. On average, the market trades around a 16 P/E multiple. By this measure, the market is overvalued/expensive.
However, the market is forward-looking. According to EarningsTrends, S&P earnings are expected to increase over 20% in 2021, bringing that 38 PE down to a more reasonable, normalized level.
4. TINA & Cash on Sidelines
“TINA” stands for “There is no alternative.” This is a follow-up on the Fed keeping rates low.
Where can you go right now for a positive return after taxes & inflation?
The bank is paying about .10% for money market accounts. A 5-year CD yields a whopping 1%. There are roughly $16 trillion sitting on the sidelines. With yields like that, people need to take some risks.
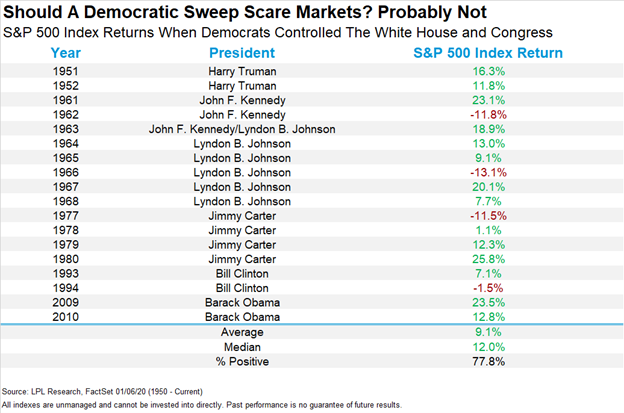
5. Recent Election Results
With the Georgia runoff and the Democrats flipping the Senate seats, they now control the House, the White House, and, likely, the Senate. Historically, markets prefer a split government. However, according to LPL, these are the most recent returns during a democratic “sweep.”
6. More Stimulus
Most likely, we will see another round of stimulus outside of the Paycheck Protection Program and $137 billion in second-draw loans. After the market crash in 2008 and 2009, elected officials realized a Band-Aid could not stop the economy from crashing.
To have a real impact, they know they need to throw everything, including the kitchen sink, at this pandemic. We believe that will continue until things look better.
7. Consumer Sentiment is Poor
Market cycles consist of many phases and feelings.
Here is a diagram from FXStreet:
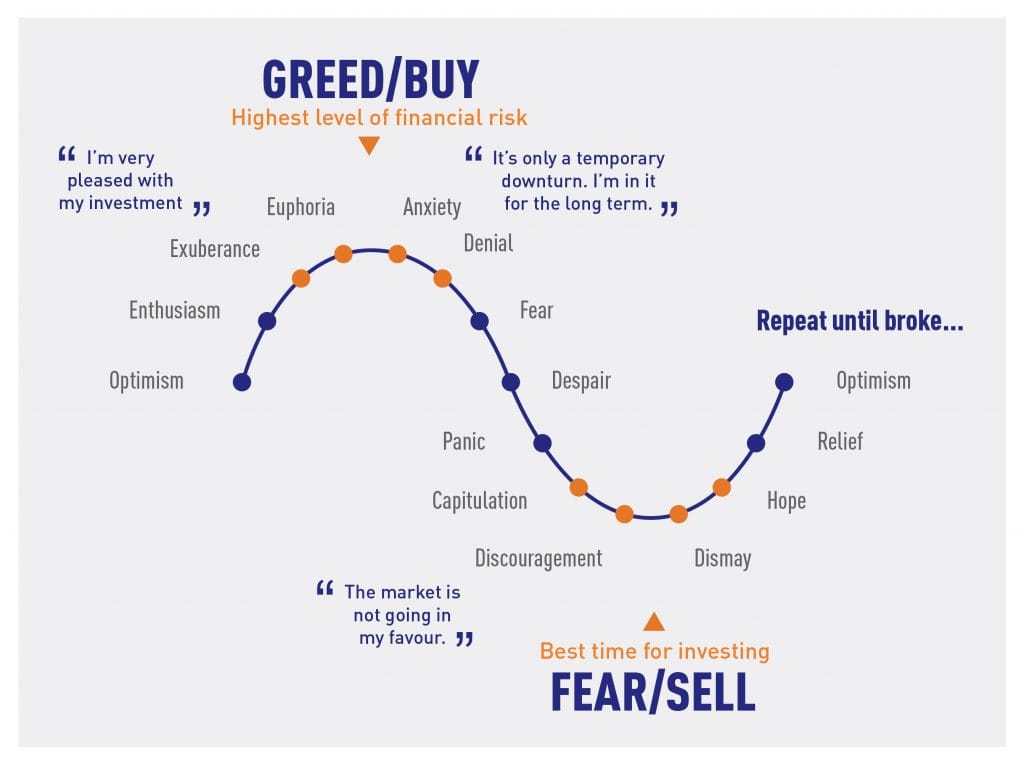
We don’t know exactly where we are on the curve. Based on our discussions with clients and other industry professionals, we believe we haven’t yet reached the peak, euphoria. There are asset classes that may have reached that stage, but most valuations are still “reasonable.”
8. Pent-Up Demand
Last week, the forecasting firm sharply upgraded its economic growth projection for next year, to 4.3% from 3.1%, in good part because of better-than-expected news on vaccines and expectations of more federal relief (Don Lee, LA Times).
“There is a strong case for that pent-up demand to be unleashed. Perhaps starting by next summer,” said James Bohnaker, an economist at IHS Markit.
Peter Lynch, the famed Fidelity Magellan fund manager, once said:
“Far more money has been lost by investors preparing for corrections, or trying to anticipate corrections, than has been lost in corrections themselves.”
Regardless of what happens this year, we know that past performance shows us that the odds are in our favor if we continue to take the long view with our investing. As always, thank you for reading. We appreciate your trust. Please contact us with questions.